
ESSO - Indian National Centre for Ocean Information Services
(An Autonomous Body under the Ministry of Earth Sciences, Govt. of India)
Selected Results
Evaluation of the TropFlux product
In Praveen Kumar et al. 2012 and Praveen Kumar et al. 2013, we have evaluated various widely
used surface heat flux / wind stress products (TropFlux, NCEP, NCEP2,
ERA-I and OAFLUX / QuikSCAT) against surface fluxes derived from
Global Tropical Moored Buoy Array data.
While this does not constitute an independent validation (most of these
products use Global Tropical Moored Buoy Array data in their derivation), this is at least a test
of the capacity of each product to fit the largest repository of air-sea
flux data in the tropics.
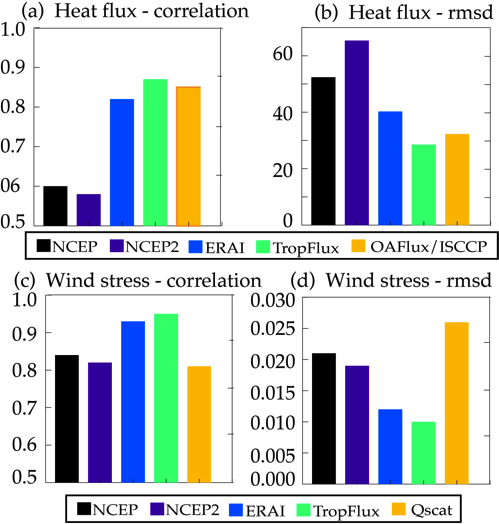
Caption figure 1 : correlation and rms-difference of various daily net heat flux / wind stress module products to global tropical moored buoy array daily data (computed at each site and then averaged across the sites).
Figure 1 shows that, for both wind stress and net heat fluxes, TropFlux is the product that displays the highest correlation and lowest rms-difference to observations (closely followed by OAFlux heat fluxes and ERA-I wind stresses). This is an indication of the very high accuracy of the TropFlux product. Additional validations to independent data in Praveen Kumar et al. 2012 and Praveen Kumar et al. 2013 also seem to suggest that TropFlux is amongst the most accurate tested products.
Tropical climate mean state and variability from TropFlux
Here, we illustrate briefly how TropFlux captures climatological heat fluxes in the tropics, and temporal variability across timescales (in particular at interannual and intraseasonal timescales).
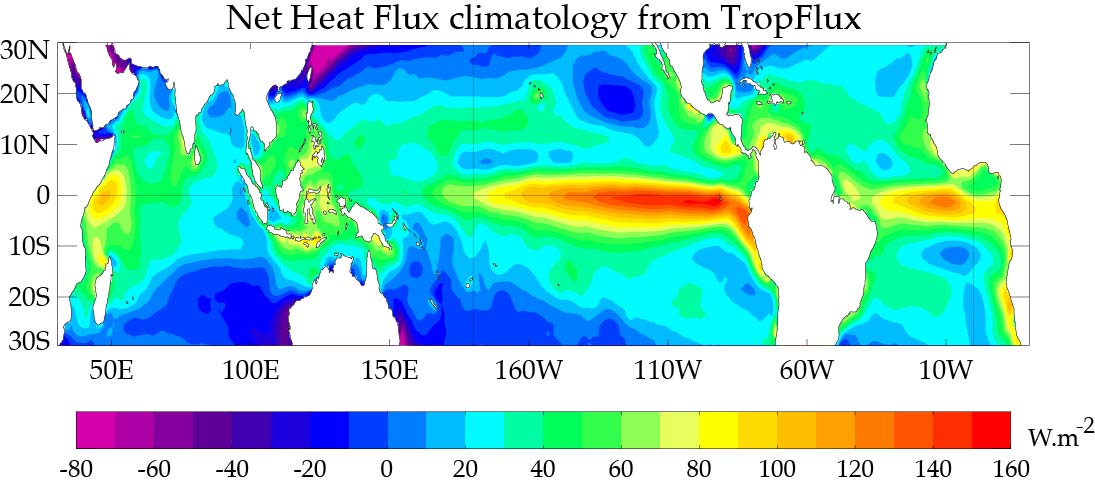
Caption figure 2 : TropFlux net flux climatology (1989-2010).
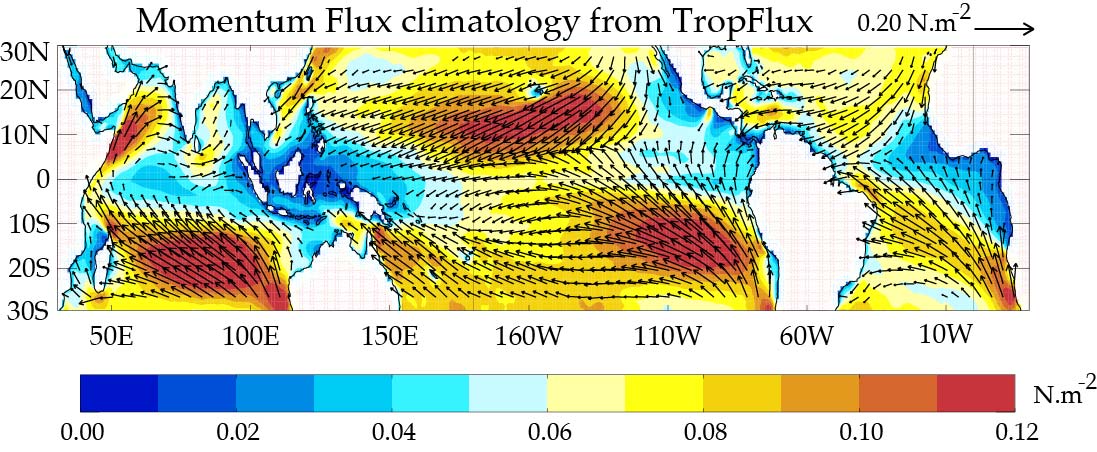
Caption figure 3 : TropFlux wind stress climatology (1989-2010).
The main pattern visible on figure 2 is the large heating of the Pacific and Atlantic cold tongues. Figure 3 shows very clearly the easterlies in the Tropical Pacific and Atlantic Oceans, the monsoon flow in the Indian Ocean, and very weak winds in convergence zones (western Pacific, equatorial Indian Ocean, eastern Atlantic and Pacific ITCZ).
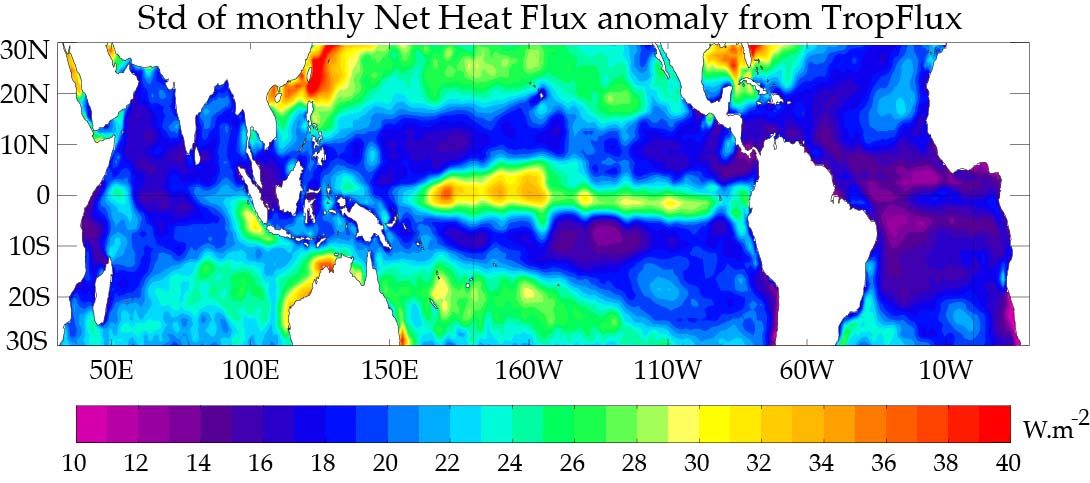
Caption figure 4 : Standard deviation of TropFlux net heat flux monthly anomalies with respect to the mean seasonal cycle (1989-2010).
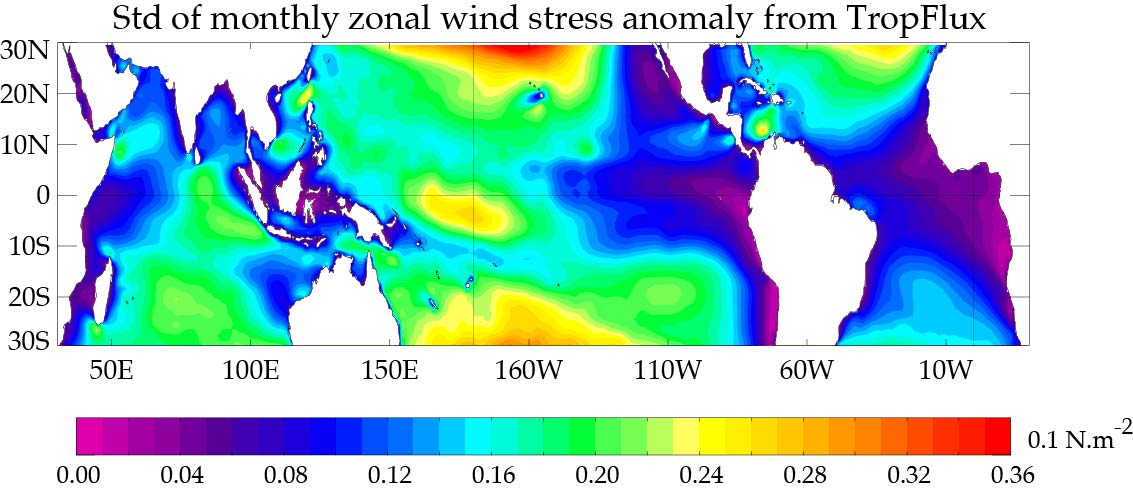
Caption figure 5 : Standard deviation of TropFlux wind stress monthly anomalies with respect to the mean seasonal cycle (1989-2010).
Figures 4 and 5 show low frequency non-seasonal variability (i.e. interannual variability). There is of course increased variance toward mid-latitudes due to the effect of midlatitude stochastic forcing. But interannual wind stress and heat flux variations associated with the El Niño phenomenon are very clear close to the equator and dateline. In the eastern equatorial Indian ocean, there is also a clear interannual wind stress variability associated with the Indian Ocean Dipole and remote response to El Niño.
Intraseasonal variability
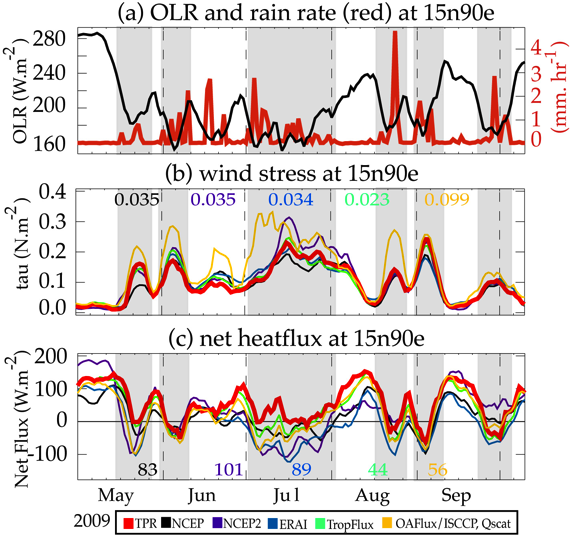
Caption figure 6 : 7-day low-passed a) Outgoing longwave radiation (a proxy of deep atmospheric convection), b) wind stress and c) net air-sea flux at the 15°N, 90°E RAMA mooring during the 2009 monsoon. Low values in the first panel indicate deep atmospheric convection (monsoon active phases, roughly outlined from the grey stripes). The rain rate measured by the mooring is shown in red on panel a. Panels b and c show the RAMA mooring-derived air-sea fluxes estimates (thick, red curve) and estimates from the other products in various colors. The root-mean square difference of each product with TPR is indicated on panel b (in N.m-2) and c (in W.m-2).
Finally, figure 6 is an illustration of intraseasonal surface fluxes variations captured by the TropFlux (and other) products. The summer monsoon is associated with intraseasonal variations of the convection, at a quasi bi-weekly and at a 30-50 days timescale (e.g. Goswami 2005), which modulate rainfall over India. Those intraseasonal oscillations have a clear surface temperature response in the Bay of Bengal (e.g. Vialard et al. 2012), which may feedback on the atmospheric convection (e.g. Sobel et al. 2008). The grey stripes on figure 6 are associated with “active” periods of intense convection (local minima in OLR values). During these periods, there are strong winds in the Bay of Bengal that result both in strong wind stresses, and intense latent heat fluxes. These intense latent heat fluxes combine with decreased surface shortwave radiation (due to clouds), and result in decreased net heat fluxes. While all products display qualitatively increased wind stresses and decreased heat fluxes for active convection phases, there are non-negligible differences between products. For the particular intraseasonal event shown here, TropFlux has again the lowest rms-difference to RAMA flux data amongst all products.